View Power BI reports
Watch a video
View reports from the Power BI Service
You can view reports from the Power BI Service that have been published to a workspace.
-
Sign in to the Power BI Service.
-
Browse to your workspace, then select Reports and choose the report.
Note: If you haven't yet set up the example report, see Create Power BI reports.
View the example report
We provide an example Power BI report template to get you started.
Select the tabs in the report to view the different pages:
-
Customers.
-
Sales.
-
Aged Debt.
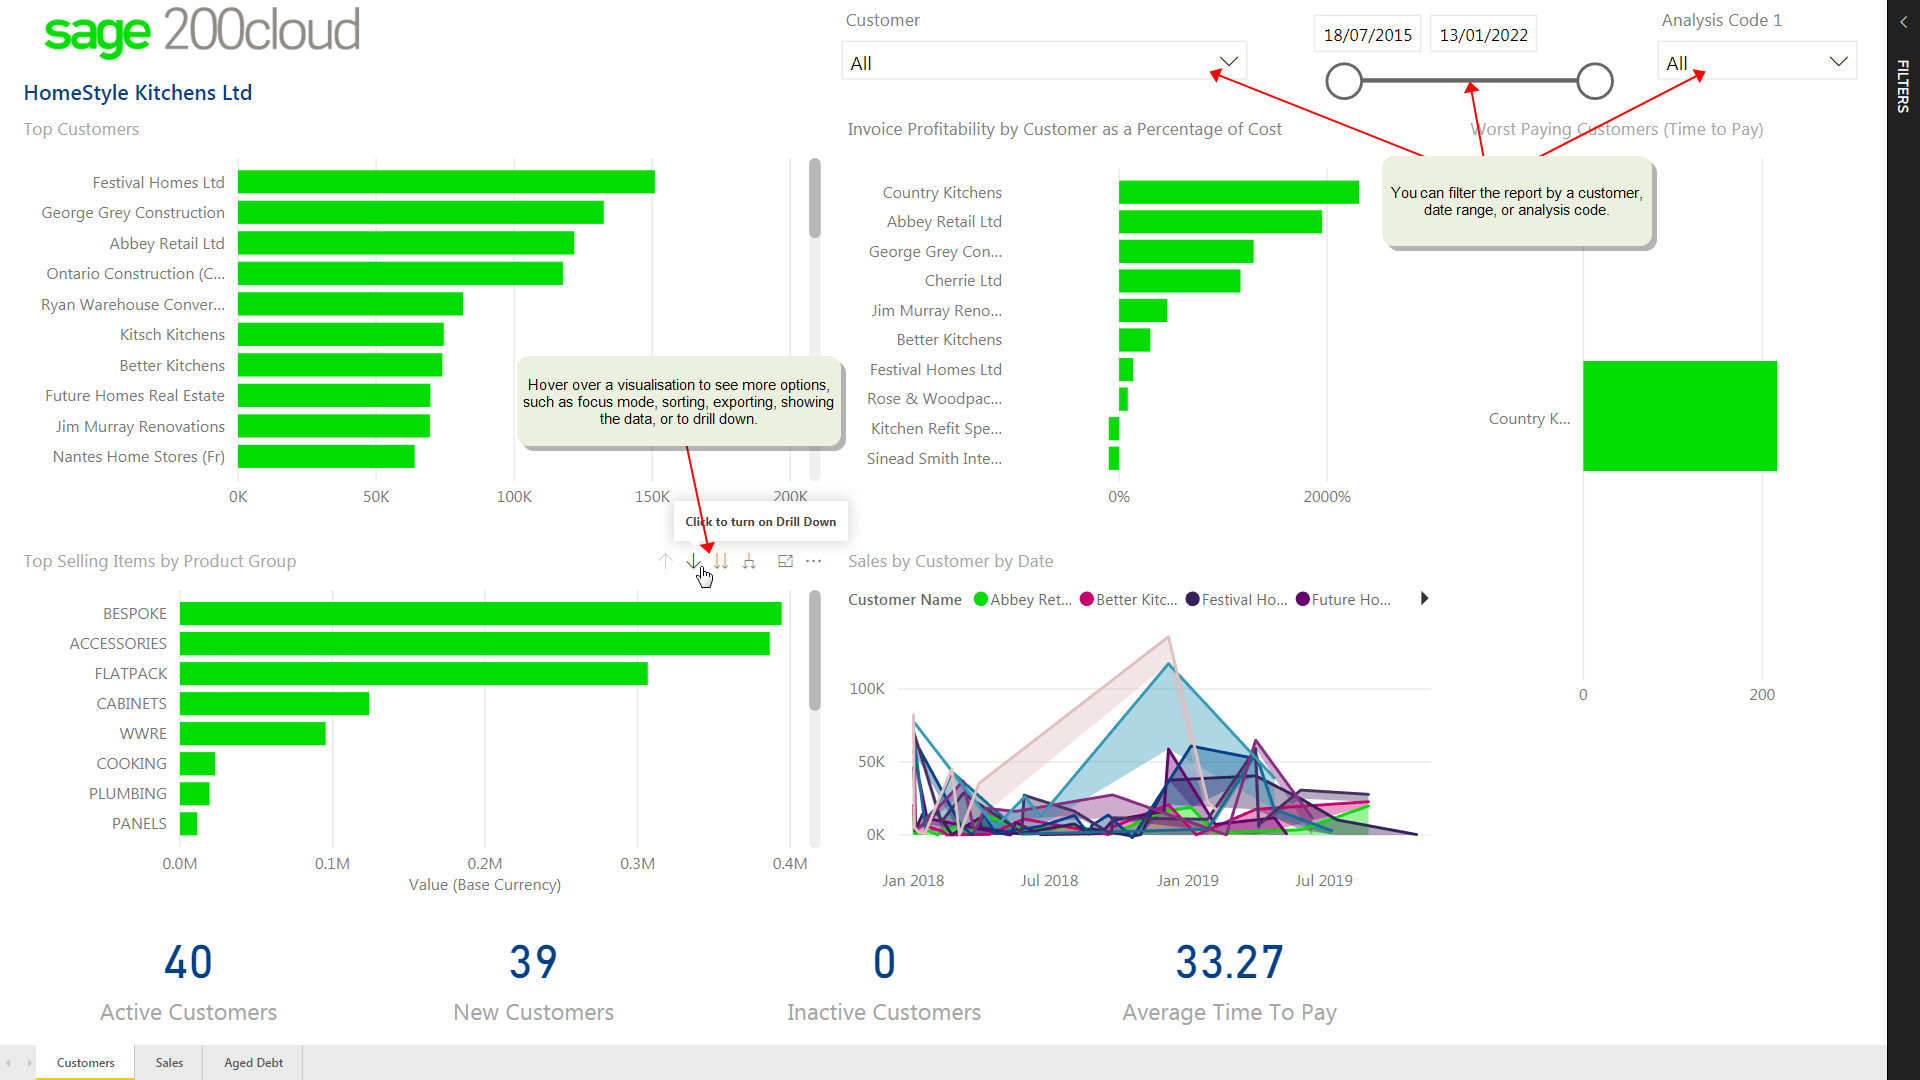
Customers
This report provides an overview of your customers, including your best customers, your top selling items, and worst paying customers.
-
Use the report filters, to show information by Customer, date range, or an Analysis Code value.
-
Top Customers: This shows your customers listed in order of their net sales value.
-
Top Selling Items by Product Group: The stock product groups containing the best selling stock items, listed in order of their net sales value (in base currency). You can drill-down on the product group to see the stock items in that group.
-
Invoice Profitability by Customer as a Percentage of Revenue: The invoice profitability of the invoices for each customer. The invoice profit (also referred to as the Gross Margin) is calculated as the difference between the cost of the lines in the invoice and the revenue received.
-
Sales by Customer by Date: The net sales value of each customer by date.
-
Worst Paying Customers (Time to Pay): The worst paying customers in order of number of days, based on their longest overdue invoice.
-
Active Customers: Number of customers that have been invoiced during this date range.
-
New Customers: Number of customers that were first invoiced during this date range.
-
Inactive Customers: Number of customers that have not been invoiced during this date range.
-
Average Time to Pay: The average time (in days) that it takes the customers to pay their invoices.
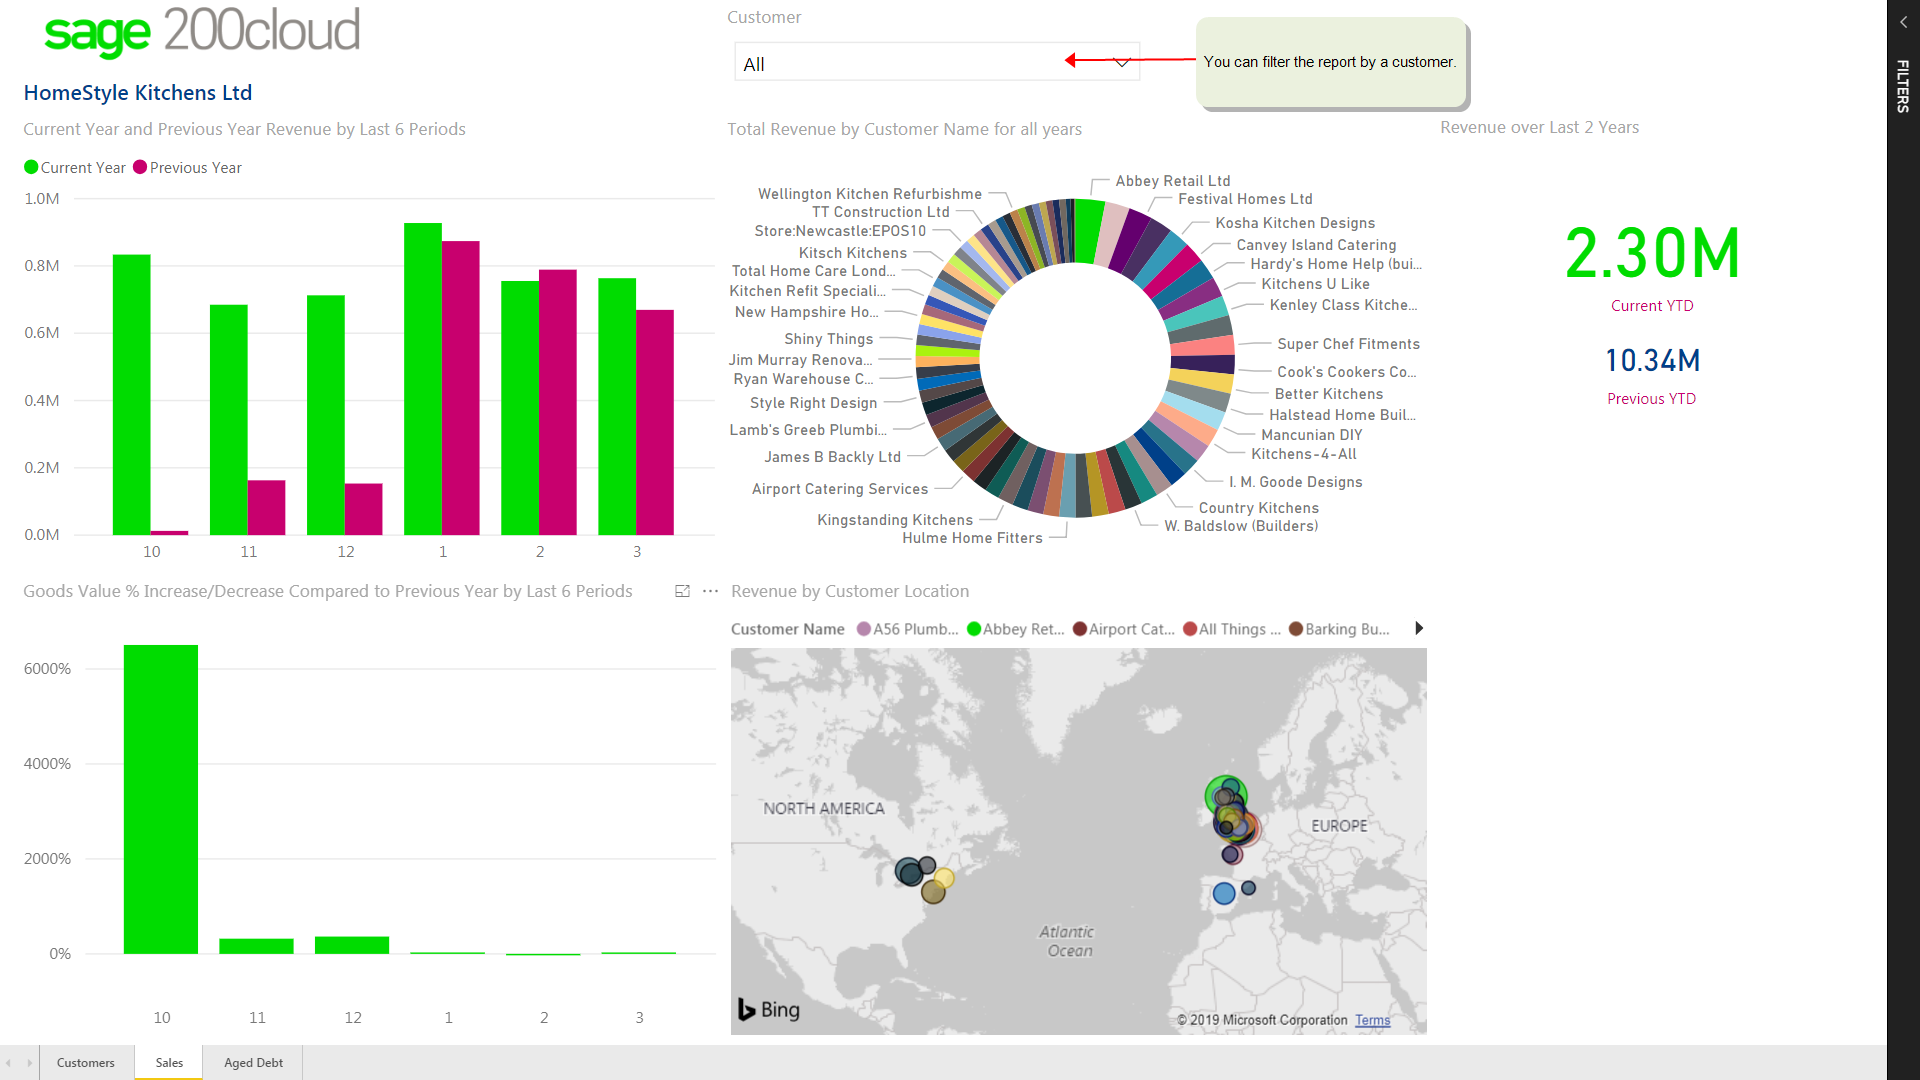
Sales
This report provides an overview of your sales revenue, so you can compare your sales figures against previous years, and view revenue by customer.
-
Use the report filter to show information by Customer.
-
Current Year and Previous Year Revenue by Last 6 Periods: A comparison of the revenue by period for the current and previous year, showing the last 6 periods.
-
Total Revenue by Customer Name for all years: The total sales revenue for each customer, based on all years to date.
-
Revenue over Last 2 Years: The total revenue of the current year to date, compared against the previous year.
-
Goods Value % Increase / Decrease Compared to Previous Year by Last 6 Periods: A comparison of the percentage change in goods value for the current and previous year, showing the last 6 periods.
-
Revenue by Customer Location: This shows a map of where your revenue comes from, based on the address of each customer.
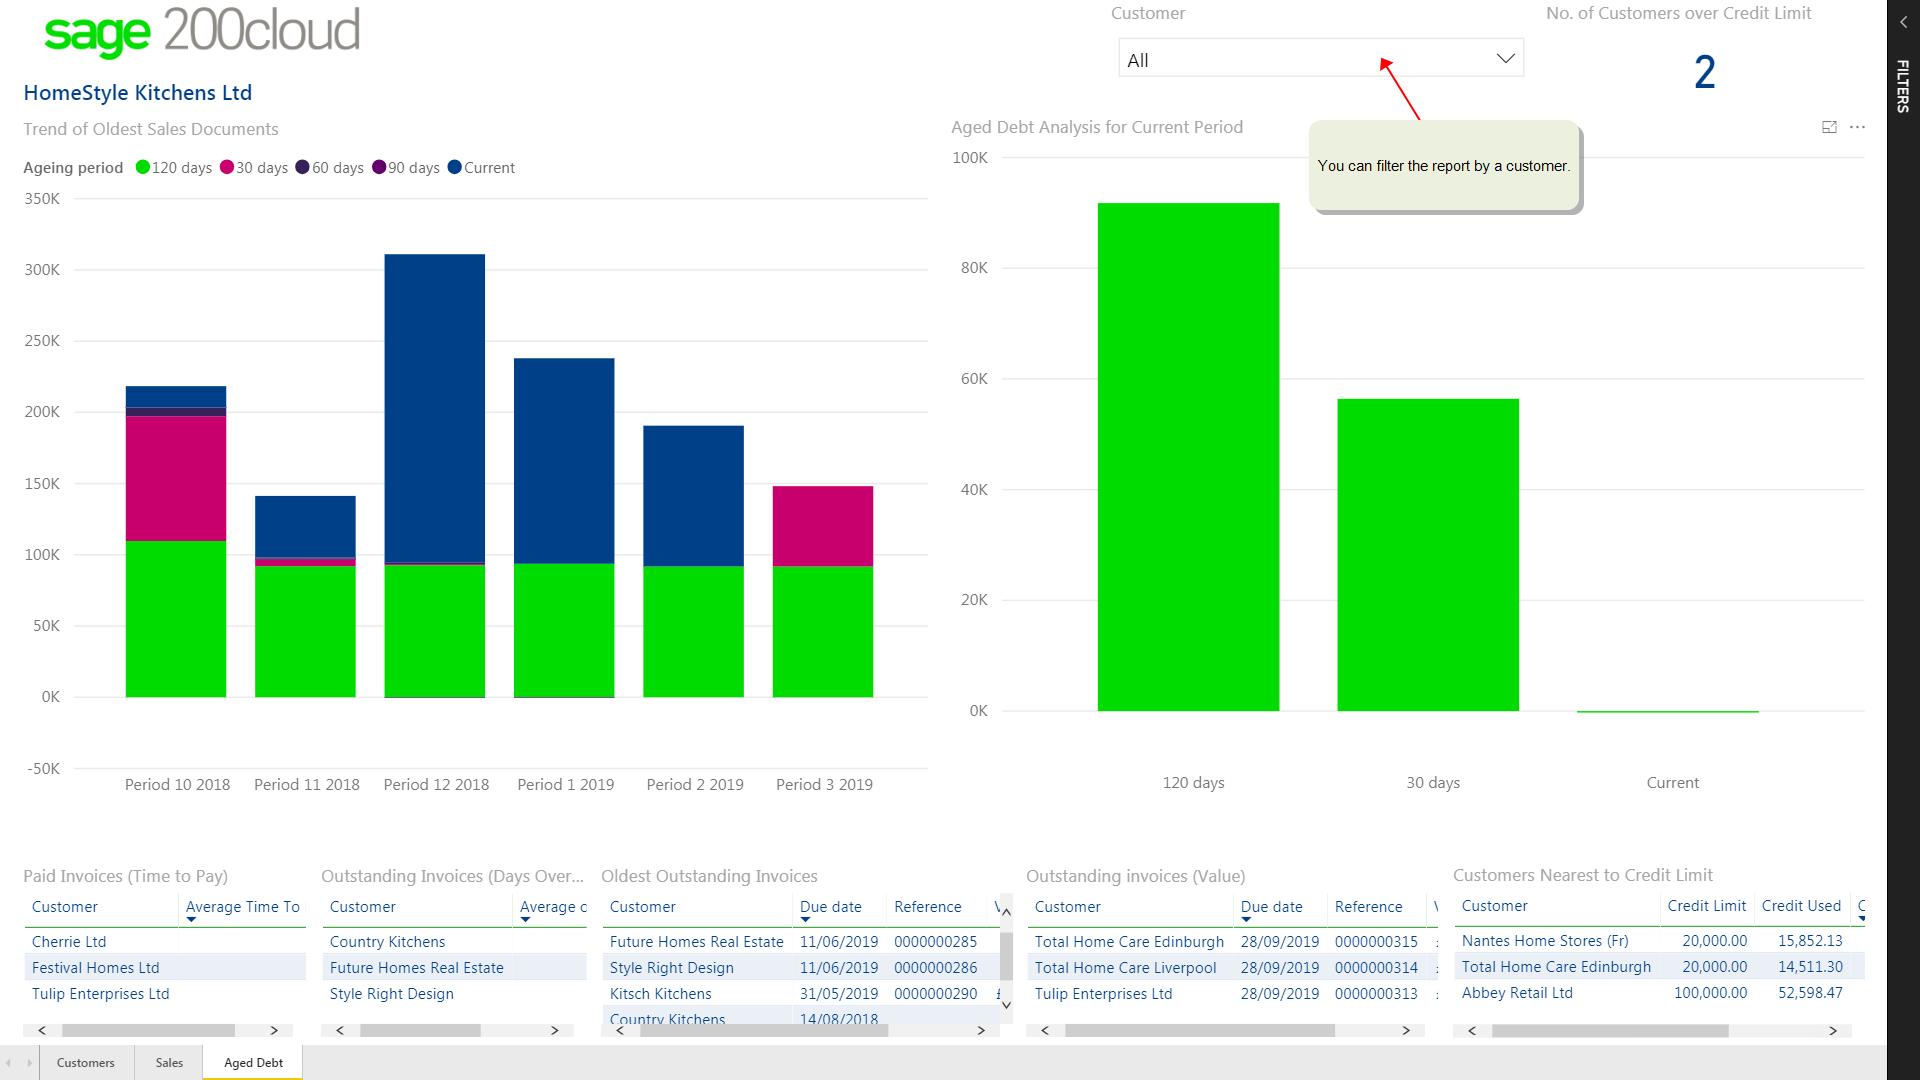
Aged Debt
This report provides an overview of your customer debt (aged debtors), so you can focus on which customers have owed you money for the longest period, or who owes you the most money.
-
Use the report filter to show information by Customer.
-
Trend of Oldest Sales Documents: This shows the total value of outstanding sales documents for the last 6 periods, with the value grouped for each ageing period (e.g. 30 days, 60 days, 90 days).
-
Aged Debt Analysis for Current Period: This shows the total value of outstanding sales documents for the current period, with the values for each individual ageing period.
-
Paid Invoices (Time to Pay): The time it takes customers to pay invoices, ordered by the average time in days.
-
Outstanding Invoices (Days Overdue): The average number of days that unpaid invoices are overdue, by customer.
-
Oldest Outstanding Invoices: Outstanding invoices ordered by the oldest due date.
-
Outstanding Invoices (Value): Outstanding invoices ordered by their value.
-
Customers Nearest to Credit Limit: Customers that are near their credit limit, ordered by percentage of their credit limit used.
-
No. of Customers over Credit Limit: The number of customers who have exceeded the Credit limit set on their customer account.
The information in this report will reflect your customer settings.
-
The ageing period groups are defined in the customer settings for Ageing; e.g. 30 days, 60 days, 90 days.
-
The transactions are aged using the transaction date, the due date, or the calendar month.
You can choose which ageing method to use by setting the Ageing Type when you first open the report. To change it after opening the report, use Edit Queries > Edit Parameters.